🖼️ Tool name: ToDiagram
🔖 Tool classification:
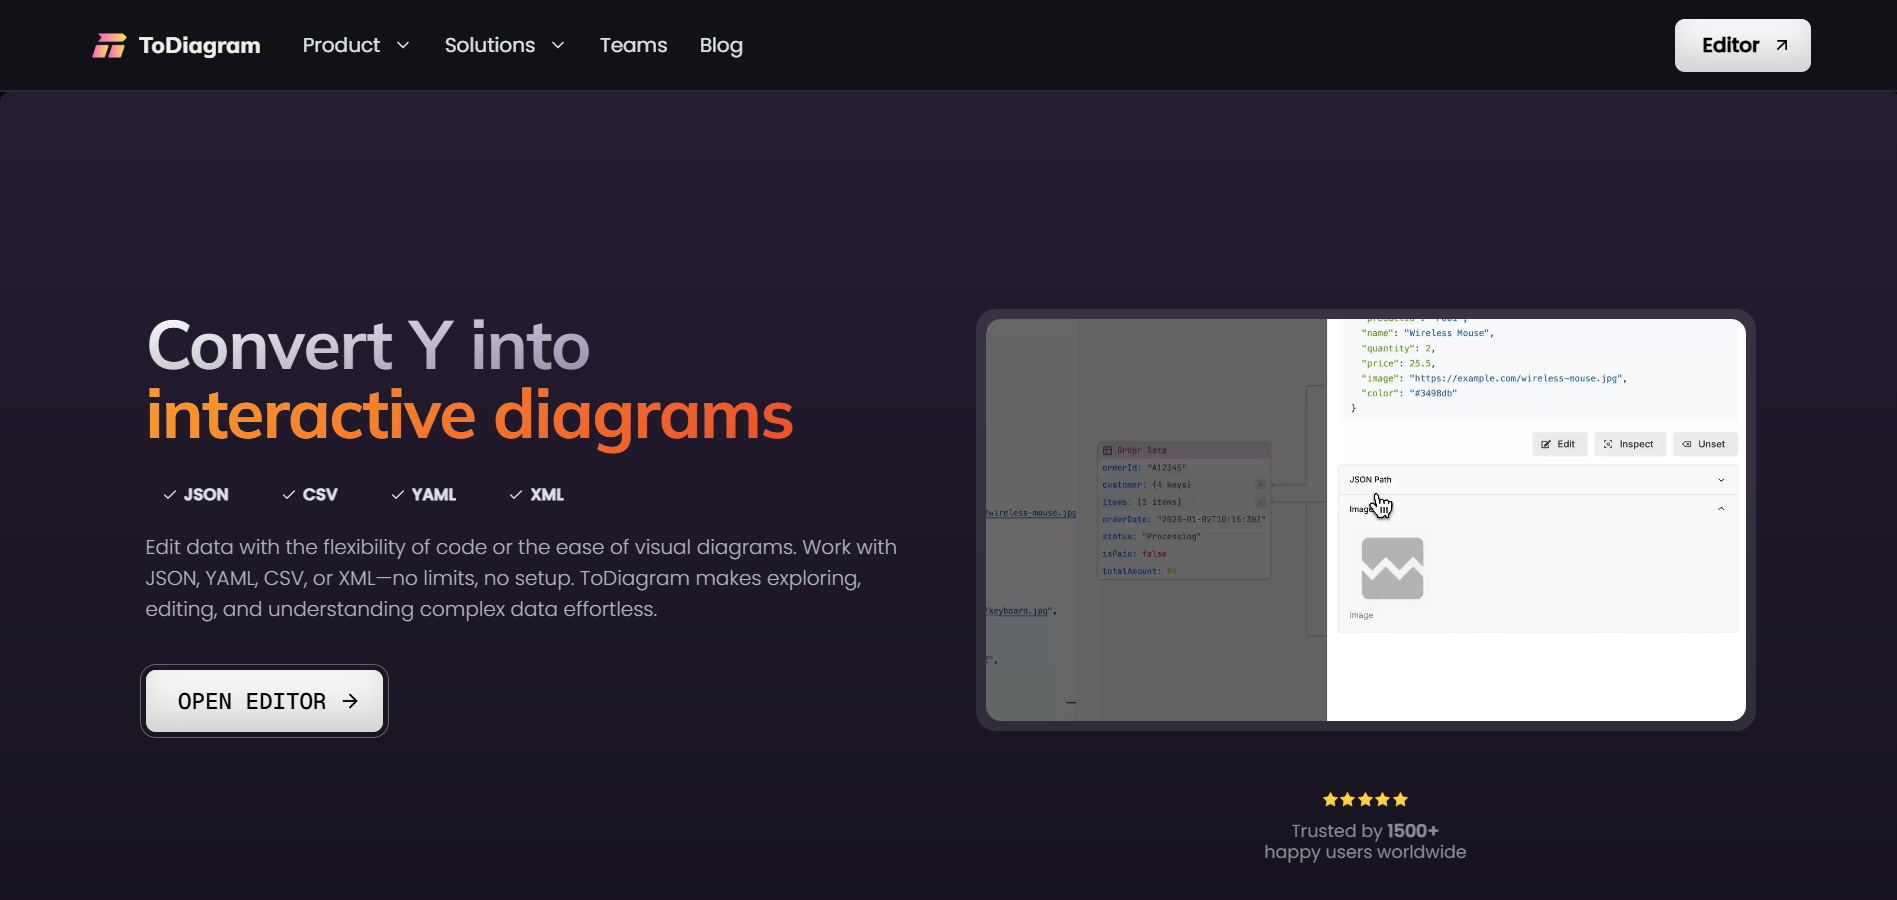
A tool for converting data into interactive charts, intended for developers and analysts working with JSON, YAML, XML, and CSV files.
✏️ What does it do?
ToDiagram is a smart tool that helps convert complex textual data into visual charts that make it easier to understand structure and correlations. It offers basic functions such as:
- Convert data from JSON, YAML, XML, and CSV formats into interactive, navigable diagrams.
- Modify data through a straightforward visual interface without the need to write code.
- Compare two sets of data to identify subtle differences.
- Save data and charts to the cloud and share them easily.
- Support for a Chrome extension that allows quick editing of data from any page.
⭐️ What does the tool actually offer based on user experiences?
- Made complex data easier to understand visually, helping developers read and analyze structural files more quickly.
- Helped to easily detect structural errors within JSON or XML files.
- Improved productivity in projects that require constantly analyzing and modifying data.
- It has been used by teams to document data structures within project documents or presentations.
- Its interface is simple and easy to use even for non-programmers.
🤖 Does the tool have automation features?
Yes, the tool relies on automation for several tasks:
- Analyze data and convert it into charts automatically as soon as the file is uploaded.
- Support for automating the comparison between data sets.
- Automatic generation of visual reports when entering multiple files.
💵 Type of tool (in terms of cost):
Free trial for a limited time, with paid plans for full access to advanced functionality.
🎁 What does the free version offer?
- Ability to upload data files and turn them into interactive charts.
- Basic visual editing tools.
- Partial trial of the comparison feature and cloud storage.
💳 What does the paid version offer?
- Unlimited access to all features including full automation.
- Live technical support.
- Wider customization of charts and the ability to export them in multiple formats.
- Full use of the browser extension.
⚙️ Access or source:
Available directly through the official website via browser, no software installation required.
🔗 Link to try the tool:
👉
https://todiagram.com/